Open the Jmeter Application by clicking Jmeter.bat file in your Jmeter>bin folder- 2. Right click on test plan>Thread groud>Add thread (Number of users you want to test for)
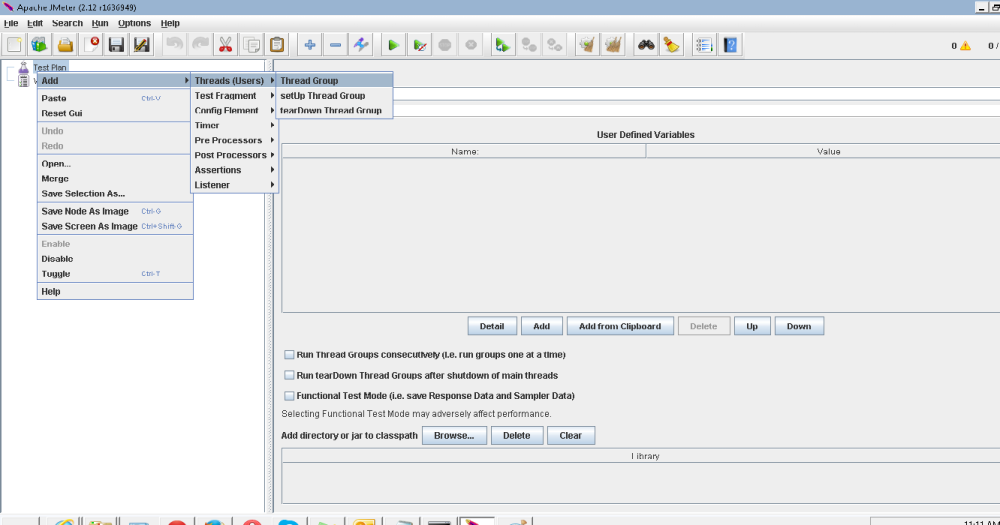 3. Right click on thread group >Logic controller> Recording controller –

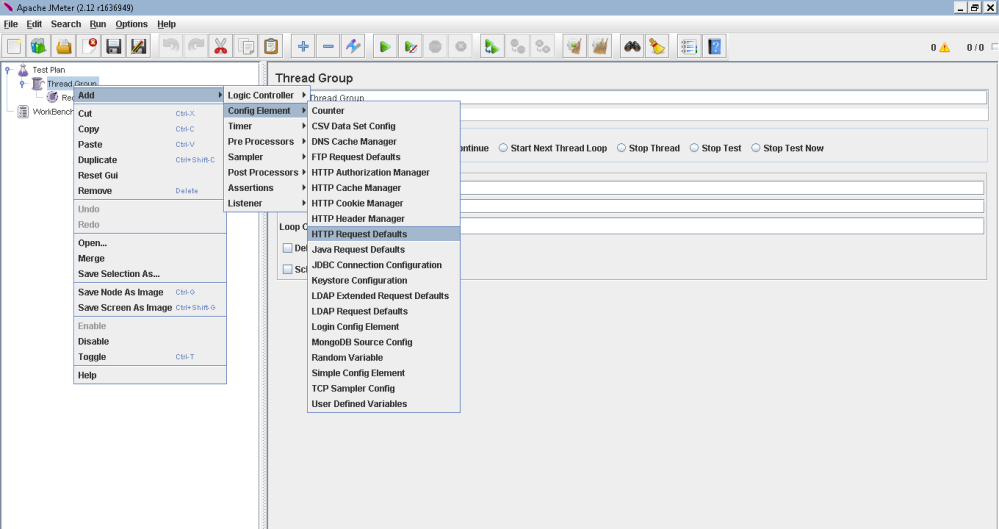
4. Right click thread group>Config elements and add all four requests
4.1 HTTP default request, HTTP Cache manager, HTTP Cookie manager,HTTP header manager
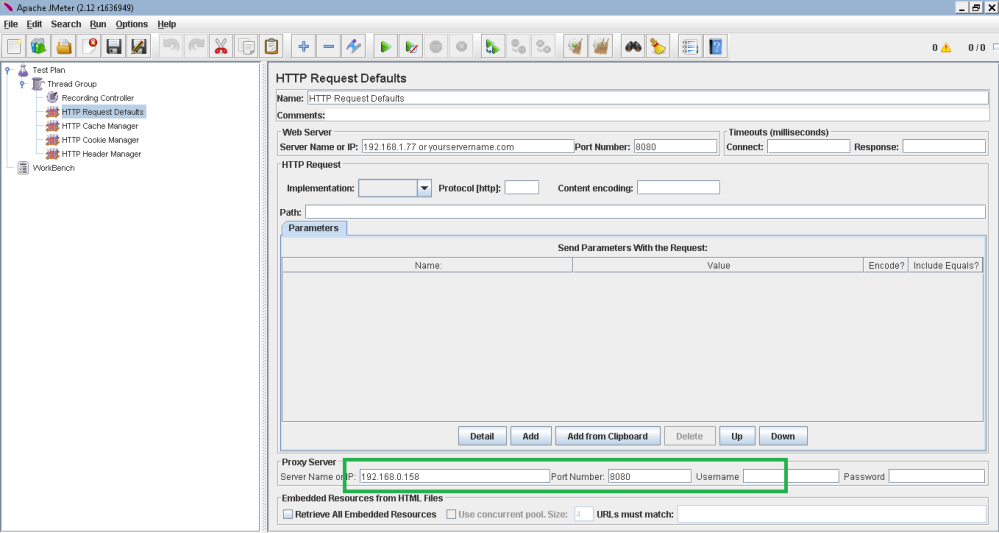
5. Now click on HTTP requests default and in right side enter server name like (jmeter.apache.org or 192.168.1.xx)and Port number (default 8080).
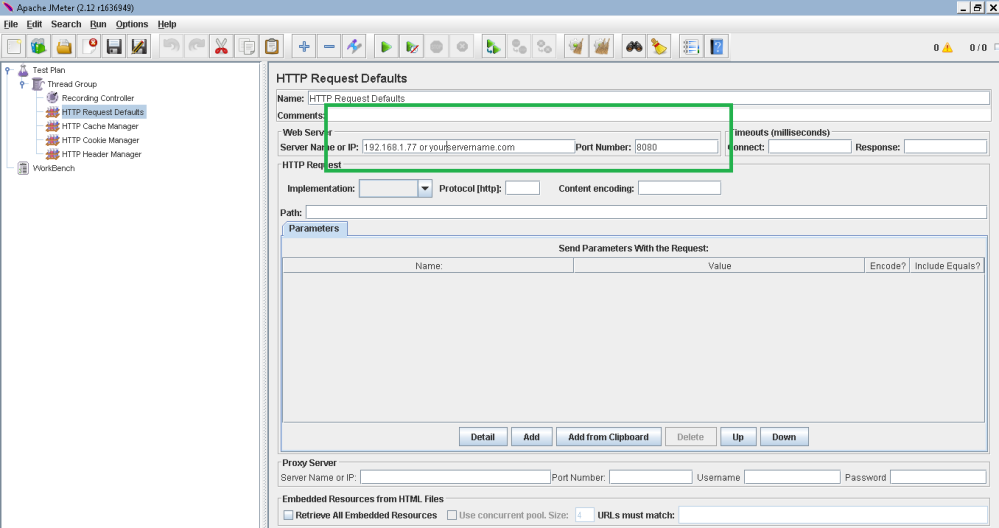
6. Enter your system’s IP and default port in bottom of the HTTP requests.But remember – Remove this IP of your system when you start to run your recorded script.I will explain in last why this is?
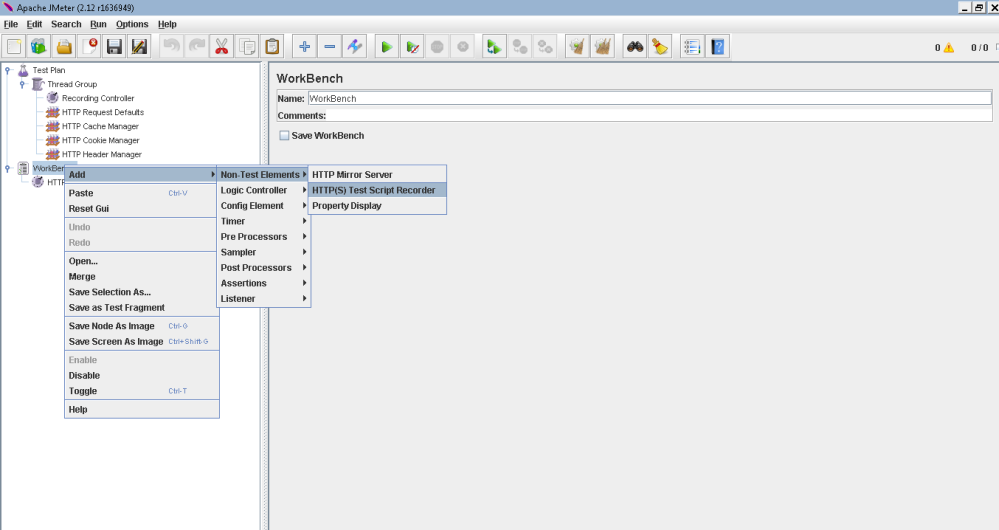
7. Now right click on workbench > Non test element> HTTP test script recorder
8. Now click start at bottom of the test script recorder –

It will show a certificate message like below –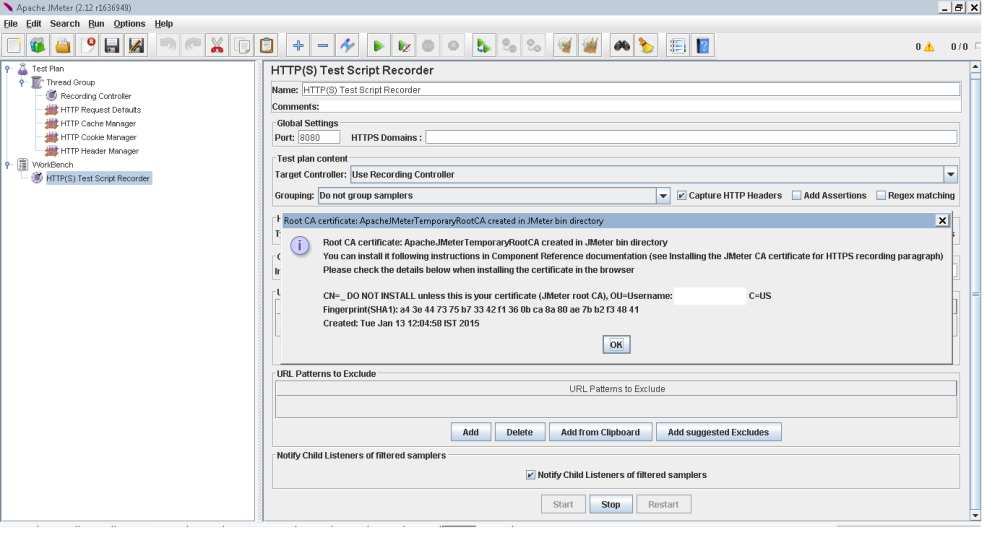
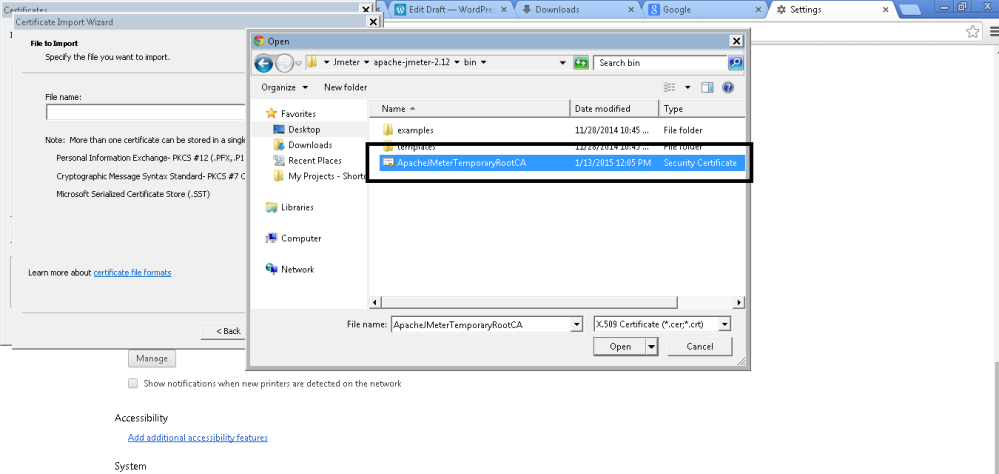
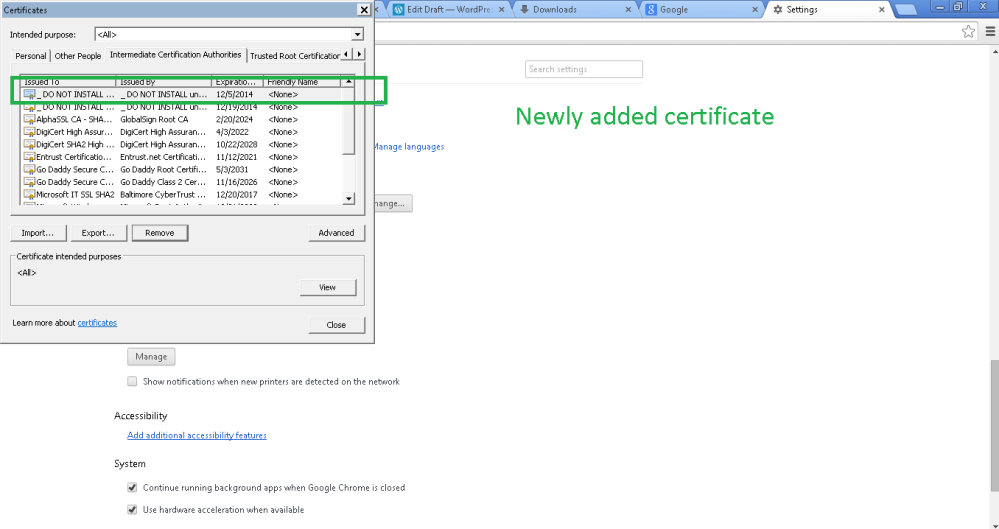
9. Now you have to configure your browser and will import this generated certificate in your browser in which you want to record script – Open any browser>go to settings>Manage certificate>Import certificate >Select the generated certificate in Jmeter>Bin folder
11. Now after import successful of this certificate, you can check it into your browser and verify the certificate details –
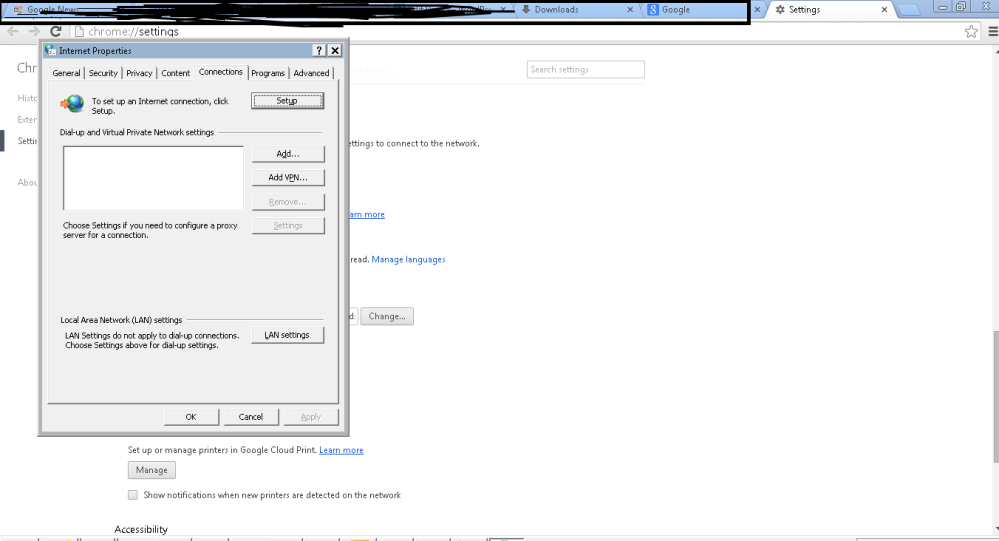
12. Now you have to set your browser for Proxy . For this Go to browser>Settings>Network>Change proxy settings – You will open this popup
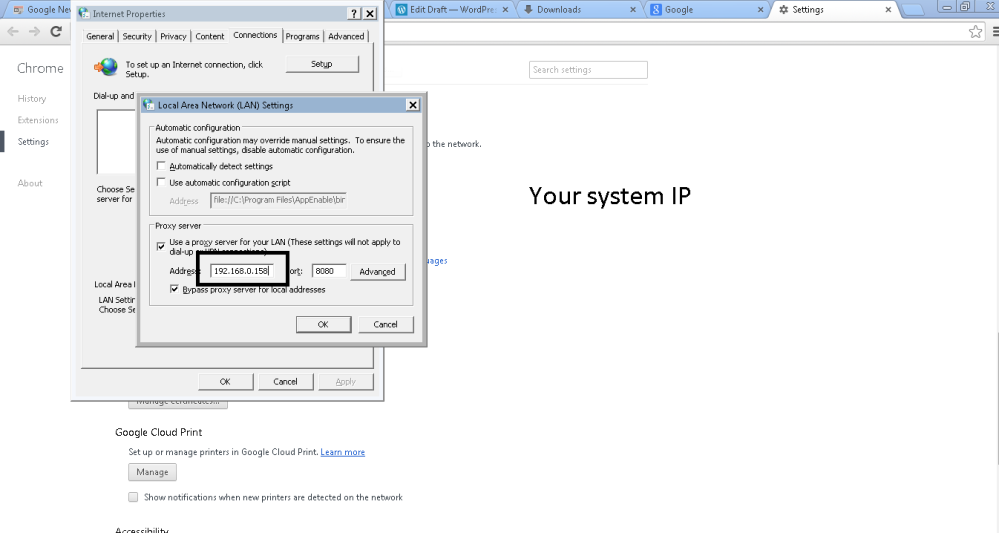
13. Now Click on Lan Settings> Uncheck all check boxes and only Check Proxy server >Use a proxy server for your LAN >Enter your System IP address and Port (default 8080)
14. Now Your browser is ready for recording. You can check this by entering any site like http://www.xxxyyy.com- It will show you page not available
15. Now come to the Jmeter and click on Start button(If it is already stop) of HTTP recorder and enter your testing site in your currently configured browser (In above steps) –
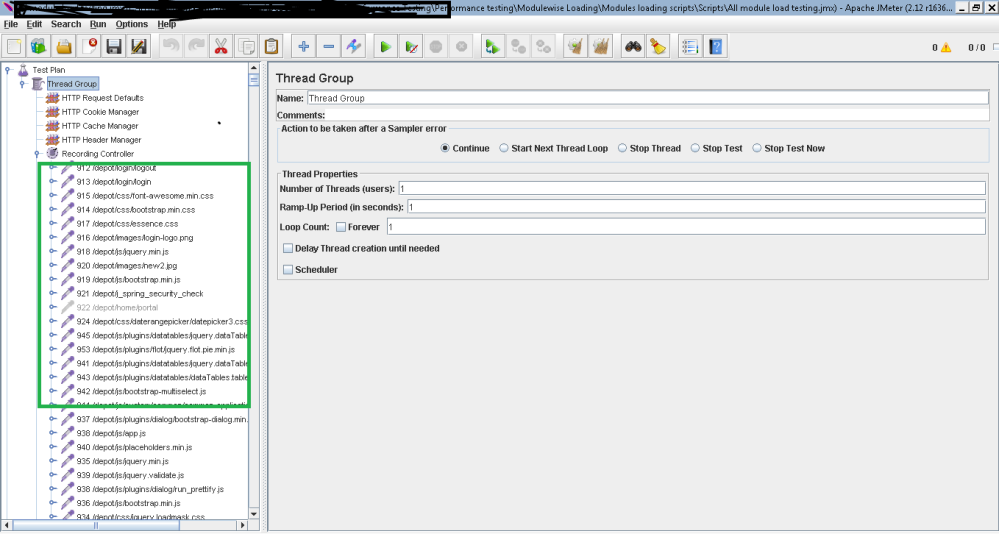
You will see the recording script working under recording controller node –
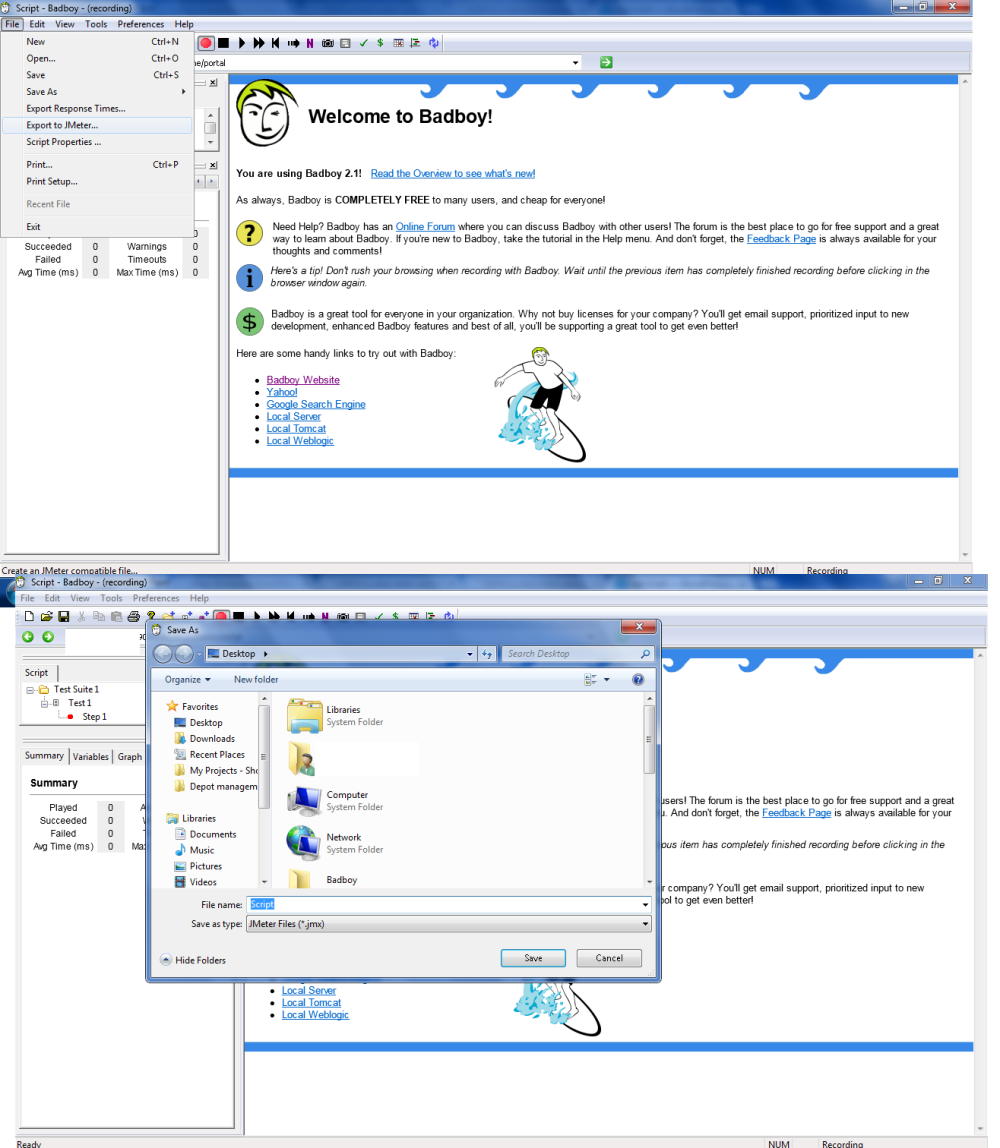
16. Now after your recording is done – Save this recording before running your test – File >Save as
17. Now you want to see your performance result so that you have to add listener before running test.You can right click on Thread group
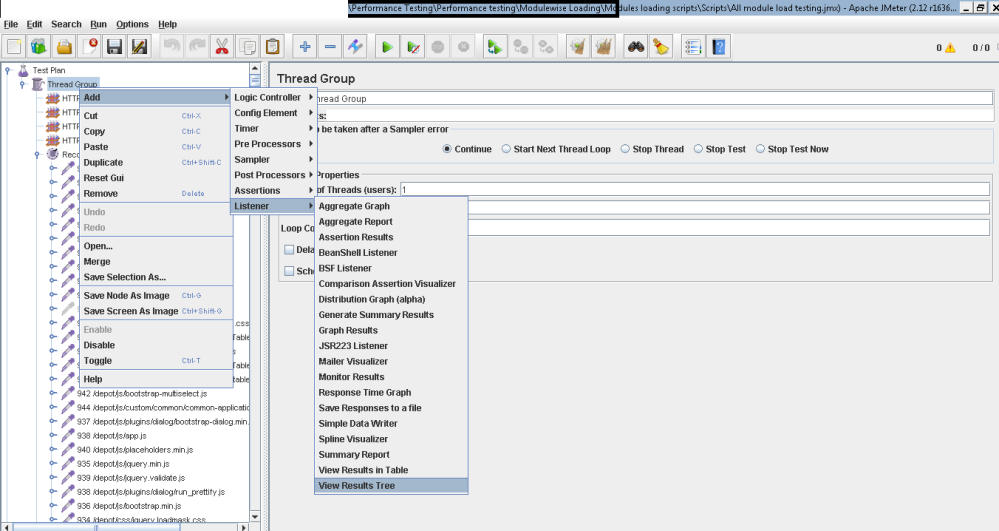
17.1 Now Click on run button (Green button >) and then select your added listener 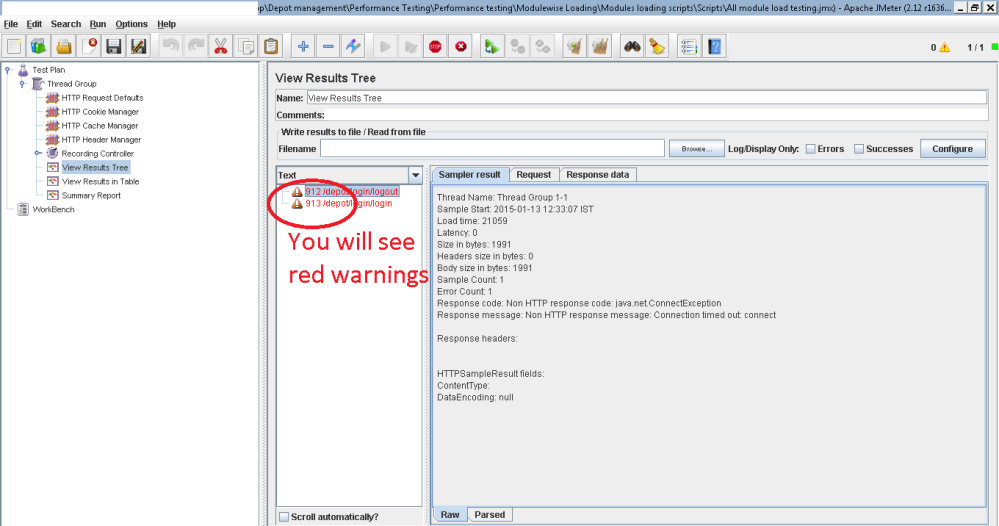 (Here is Result tree )
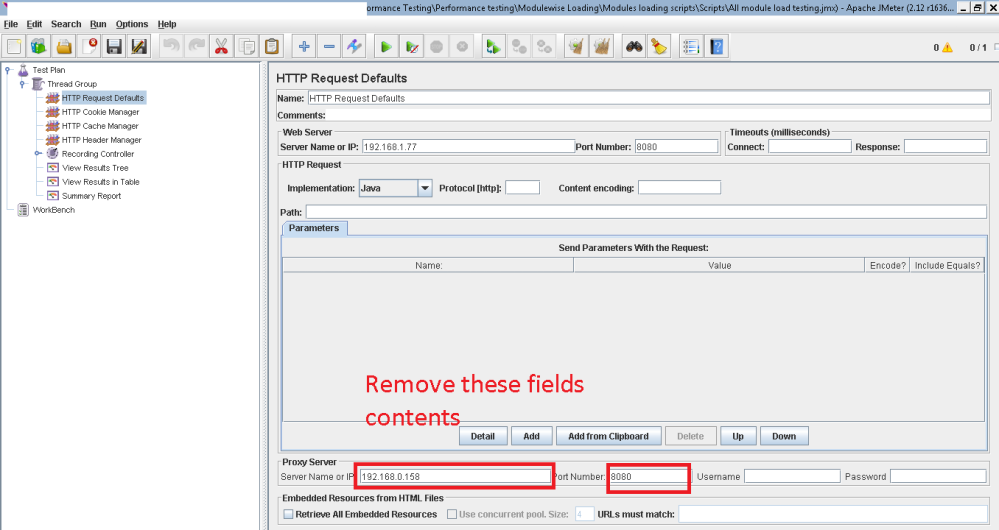
18. After running you will see warnings in your test.It means your recorded test script is not working correctly.Now go to “HTTP Request default” by clicking in thread group tree and remove your system IP and port.
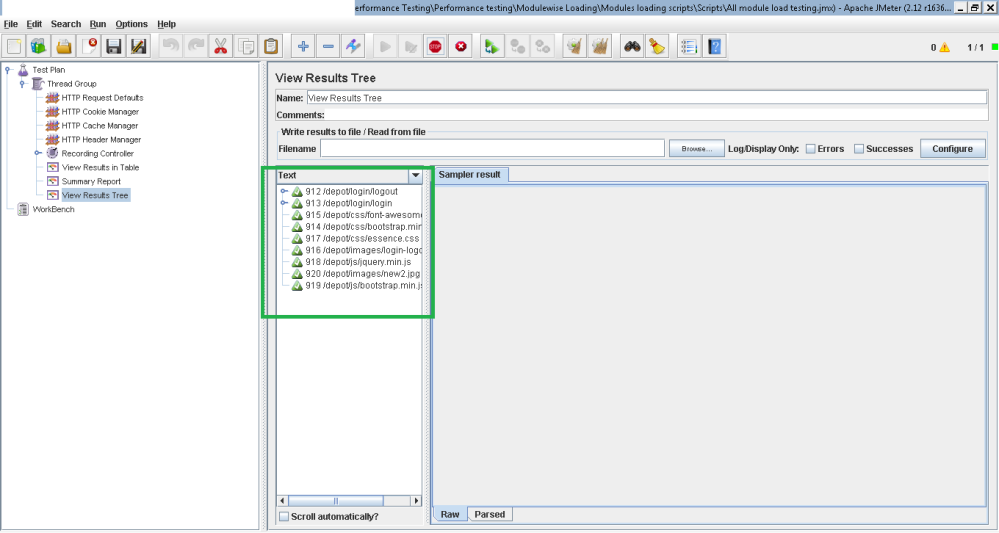
19. Now save it and run again – Now your test will be passed and will show green status
- For Checking the CPU performance, Memory Usage of the server, You have to Integrate Perfmon Plugin in your Jmeter.
You can download perfmon plugin from universal Jmeter link-
http://jmeter-plugins.org/downloads/all/
Installation or integrate Plugin with Jmeter –
- JMeterPlugins-x.x.x.zip – contains plugins, must be unpacked into lib/extdirectory inside JMeter
- Restart JMeter to load new plugins
- Now you will see something new in your JMETER – like below image

- Now you have to configure your Perfmon Metrics collector (listener) for your server on which you want to perform load.
For this You have to enter your server IP or server name like (google.com) in your Host Name and default Port should be 4444(Do not change this for all the hosts)

- Now Save the Test Plan and do not run right now as there is one important step remained. L
Your server will not send directly its CPU usage and also you do not know what amount of memory is installed on your Testing server.
For this you have to run a simple server agent Batch file for windows (For linux .sh file)
You can download this file (ServerAgent-2.2.1.zip,)from –
http://jmeter-plugins.org/downloads/all/
- Now copy this Zip file on your server on which you want to test load.(In my case I have told to my Project manager as he had the rights of testing server on which my application is running)
- Extract the file in the C driver or Project folder of which IP you are using the application.
Like in my case I was testing the application on 192.168.x.xx/projectname/login
So I have installed the server agent on 192.168.x.xx system folder where all the project files resides.
- Now come to the point and after copying server agent files. Open the folder and click on startagent.bat file on your testing server.
It will run like in command prompt black screen. Do not close this command window on your testing server until your testing is not completed for performance of CPU and memory,because this agent will send the information to the Perfmon plugin on which you are using your jmeter (Testing server and Jmeter can be on same machine. In my case I was using jmeter on my machine and testing server was installed on other machine so…..)
Now come to the machine on which you are running Jmeter.
- Now click to Run button on jmeter (Before starting if you see the chart by clicking perfmon listener, it will show message Waiting for samples….)
- After startup , it will show the grap like below –

- Your graph will show readings in Percentage on Y axis and in seconds on X axis so do not be confused.
- You can also save this graph in Image format as well as in CSV or excel format simply by right clicking on the graph.

- One thing to remember which I had mistaken – Server will not send its reading without Samples. So you have to record samples and side by side check their green status like below
So this is completed your Perfmon plugin CPU performance reading and Memory usage.
Thanks for reading …:)
See you guys in next……. 🙂
Thank you for your appreciation and donations 🙂 and if you really feel happy by reading this, then you can help us by donation using donation box or using paypal link https://www.paypal.me/knowledgeworldforyou 🙂 [Donation box is in the left side bar on our website (http://www.knowledgeworldforyouteam.com/ ) ] . We will be really grateful to you 🙂 and still we are 😉 .

Please visit us and like on social media to encourage us more for writing and sharing with You.
http://www.knowledgeworldforyouteam.com/
https://www.facebook.com/Knowledge-World-For-You-1660665640835573/timeline/
https://twitter.com/you_knowledge
Thanks!!
KnowledgeWorldforYou Team 🙂