How to use Badboy tool for Recording Jmeter load testing scripts ?

Hey Friends,

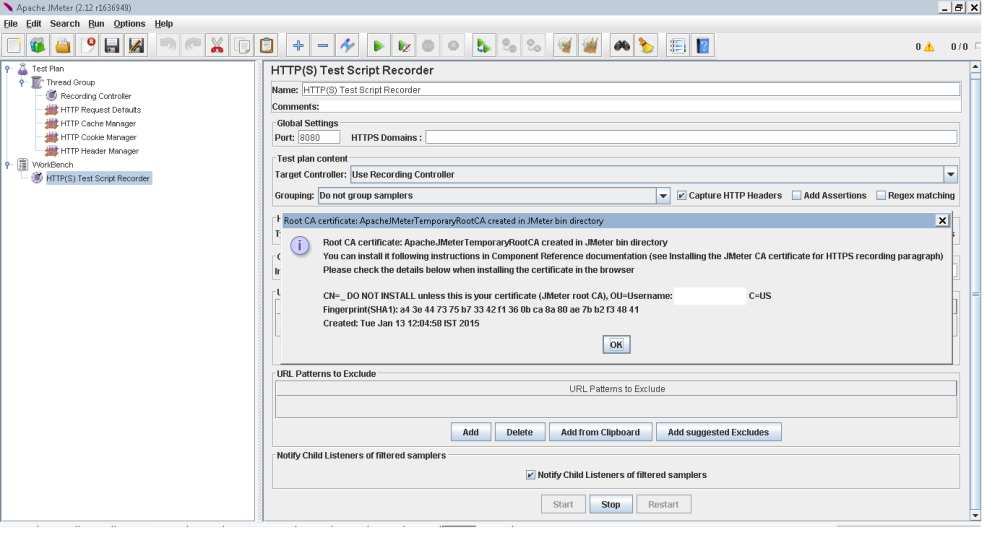
During my work, I found someone saying that this SSL techniques of Jmeter for recording the load testing script is someway hard to understand and apply, so one of my friend suggested me to use Badboy tool, it is free to use.

So How to use Badboy script in Jmeter ?

Here are the steps for beginners and smart people –

1. Install the badboy tool from linkย http://www.badboy.com.au/download.

2. Now open the bad boy tool from your startup menu

badboy1

3. This will open your bad boy tool with a cool boy icon.

badboy2

4. Now you will see an address Bar on the top of the application

badboy3

5. Enter your Application (which you want to test for load or performance) URL in the address bar and Click Green icon or directly press enter button. It will load your URL of application.

badboy4

6. Now a good point for those who are thinking that My application is working on Local IP so is it work for that ? So don’t worry my friends, it will work for those also.

You can check screenshot in above point 4, there I had used an IP address on which my application was running, so dont worry…. ๐Ÿ™‚

7. Now after entering URL of application, you can see that there is a dark red button on the tool bar of this application… Yes you got it right….. ๐Ÿ™‚ Click on that red button.

badboy5

8. Now your script recording is started, now click on the pages or actions which you seems to be performed for load testing like search records, listing pages, data grid.

9.Now export this file to Jmeter by going into File>Export to jmeter

HOW TO LOGIN IN A SITE WITH USERNAME AND PASSWORD USING SELENIUM WEBDRIVER


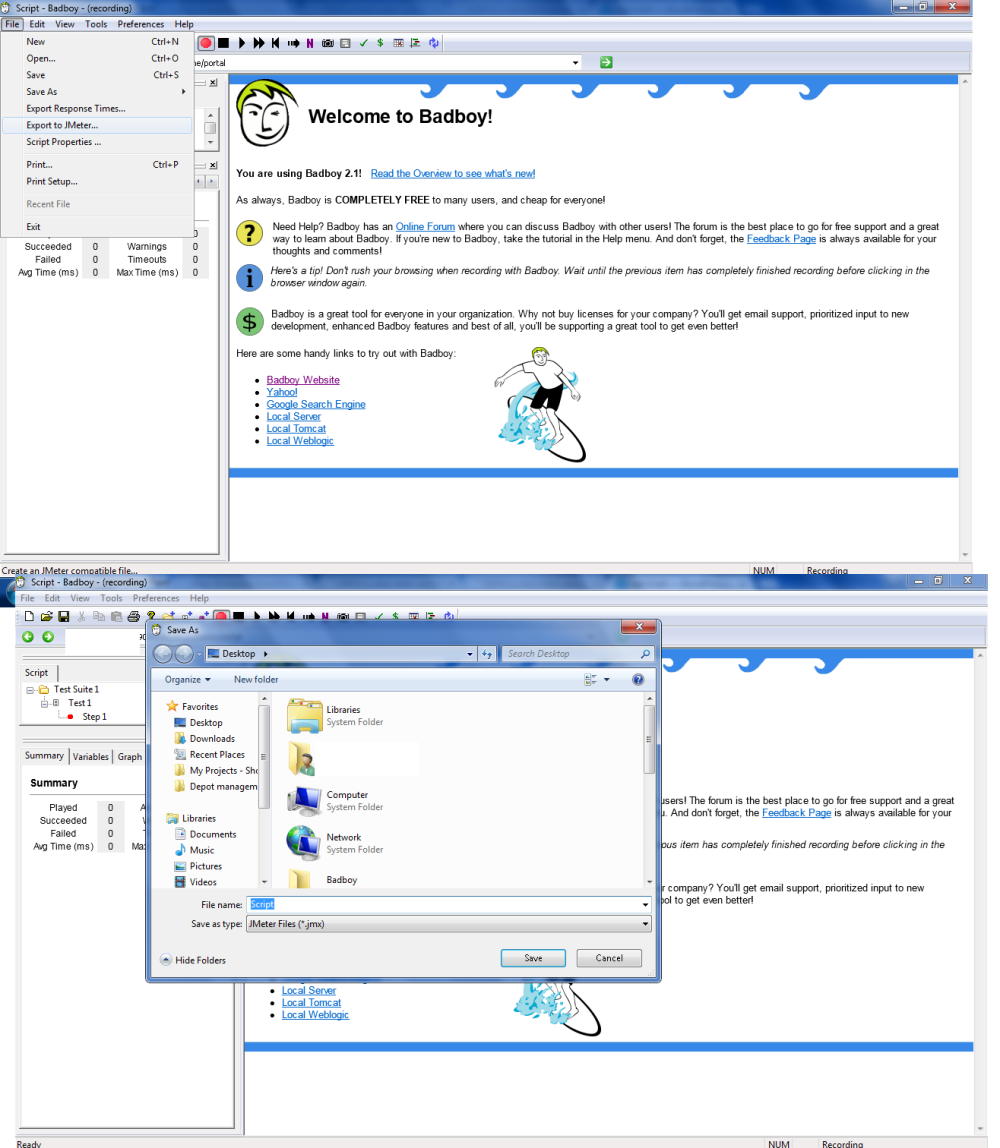
10. Now you can use this .Jmx file into your Jmeter tool and run this.

So this is all about use of badboy to create jmeter script.

You can also see the results in Badboy tool on left hand side of tool by clicking on samples

It will give you graph view etc.

I personally suggests to use Jmeter proxy recording.

Thank you guys n girls. Keep posting your responses…

Thanks for reading….See you in next post. ๐Ÿ™‚

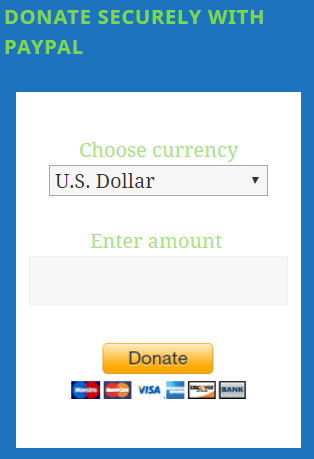
Thank you for your appreciation and donations ๐Ÿ™‚ and if you really feel happy by reading this, then you can help us by donation using donation box or using paypal link https://www.paypal.me/knowledgeworldforyou ๐Ÿ™‚ [Donation box is in the left side bar on our website (http://www.knowledgeworldforyouteam.com/ ) ]. We will be really grateful to you ๐Ÿ™‚ and still we are ๐Ÿ˜‰ .

donation-box

Please visit us and like on social media to encourage us more for writing and sharing with You.
http://www.knowledgeworldforyouteam.com/
https://www.facebook.com/Knowledge-World-For-You-1660665640835573/timeline/
https://twitter.com/you_knowledge

Jmeter Simple steps for recording Proxy test script in browser

1. Open the Jmeter Application by clicking Jmeter.bat file in your Jmeter>bin folder-

jmeter 1

2. Right click on test plan>Thread groud>Add thread (Number of users you want to test for)

jmeter 2

3. Right click on thread group >Logic controller> Recording controller –

jmeter 3

4. Right click thread group>Config elements and add all four requests

4.1 HTTP default request, HTTP Cache manager, HTTP Cookie manager,HTTP header manager

jmeter 4

5. Now click on HTTP requests default and in right side enter server name like (jmeter.apache.org or 192.168.1.xx)and Portย number (default 8080).

jmeter 5

6. Enter your system’s IP and default port in bottom of the HTTP requests.But remember – Remove this IP of your system when you start to run your recorded script.I will explain in last why this is?

jmeter 6

7. Now right click on workbench > Non test element> HTTP test script recorder

jmeter 7

8. Now click start at bottom of the test script recorder –

jmeter 8

It will show a certificate message like below –

1


9. Now you have to configure your browser and will import this generated certificate in your browser in which you want to record script – Open any browser>go to settings>Manage certificate>Import certificate >Select the generated certificate in Jmeter>Bin folder

jmeter 10

11. Now after import successful of this certificate, you can check it into your browser and verify the certificate details –

jmeter 11

12. Now you have to set your browser for Proxy . For this Go to browser>Settings>Network>Change proxy settings – You will open this popup

jmeter 12

13. Now Click on Lan Settings> Uncheck all check boxes and only Check Proxy server >Use a proxy server for your LAN >Enter your System IP address and Port (default 8080)

jmeter 13

14. Now Your browser is ready for recording. You can check this by entering any site like http://www.xxxyyy.com- It will show you page not available

15. Now come to the Jmeter and click on Start button(If it is already stop) of HTTP recorder and enter your testing site in your currently configured browser (In above steps) –

You will see the recording script working under recording controller node –

jmeter 15

16. Now after your recording is done – Save this recording before running your test – File >Save as

17. Now you want to see your performance result so that you have to add listener before running test.You can right click on Thread group

jmeter 16

17. Now Click on run button (Green button >) and then select your added listener jmeter 17(Here is Result tree )

18. After running you will see warnings in your test.It means your recorded test script is not working correctly.Now go to “HTTP Request default” by clicking in thread group tree and remove your system IP and port.

jmeter 18

19. Now save it and run again – Now your test will be passed and will show green status

Jmeter 19

So this is your test proxy recording completed successfully.

Thanks

Please like us for more to connect

http://www.knowledgeworldforyou.com/
https://www.facebook.com/pages/Knowledge-World-For-You/1660665640835573

JMETER GRID DATA LOADING TIME CALCULATION

People generally use Jmeter for calculating the load time of the page and its elements, but some time your page loads very early in seconds but the data grid or any table of data like names,countries etc takes time in loading.So if you only use the “HTTP requests default” samplers, then it does not help you to calculate the exact load.

I have also faced this problem in a project.So for calculating the overall loading time of the page, you will have to add other samplers also.

Add below three samplers and your JMETER will act like browser and will record overall loading time of the page including grid loading.

  1. HTTP COOKIE MANAGER
  2. HTTP CACHE MANAGER
  3. HTTP HEADER MANAGER
  4. HTTP REQUESTS DEFAULT

jmeter samplers

Thanks for reading…….

See you Guys in next post.

Please like us on facebook for more to connect
https://www.facebook.com/pages/Knowledge-World-For-You/1660665640835573