JMETER – DOCKER – GITLAB INTEGRATION – AFTER EVERY DEPLOYMENT, IT WILL RUN JMETER SCRIPT

Take jmeter docker image from https://hub.docker.com/

Take this jmeter image or any jmeter image from there – https://hub.docker.com/r/justb4/jmeter

Now copy the directory from git command so u will get docker files with Jmeter configurations-

docker pull justb4/jmeter

Now in directory, run test.sh file using command lines.

It will execute the jmeter but before that set jmx script path and report path in docker file

This will be docker file configuration –

This is test.sh configuration, always check these configurations and you can change path as per your local machine –

Now after above successful implementation, go to any git lab and copy paste above docker jmeter in gitlab branch.

Like this will show your folder on git –

On your main git folder or root folder, there will be a git yaml file which will connect our Docker jmeter to Git pipeline and generate the report

Put this below code block in your git yaml file to connect to jmeter, take care for paths

Jmeterrun:
  stage: testjmeter
  variables:
    PROJECT_DIR: /builds/projectpath
    JMETER_PROJECT_DIR: $PROJECT_DIR/docker-jmeter
  image: 
    name: justb4/jmeter:latest
    entrypoint: [""] 
  before_script:   
    - apk add --update zip  
  script:
    - mkdir -p -m 777 $JMETER_PROJECT_DIR/tests/report/jmeterreports
    - /entrypoint.sh -n -t ./testcalls.jmx -l $JMETER_PROJECT_DIR/tests/report/testresults.log -e -o $JMETER_PROJECT_DIR/tests/report/jmeterreports
    - cd $JMETER_PROJECT_DIR/tests/report 
    - zip -r $PROJECT_DIR/jmeter-qa-results.zip .
  artifacts:
    paths:
      - $PROJECT_DIR/jmeter-qa-results.zip
    when: on_success


Now check the pipeline status, it will show jmeter success -

Performance Testing – Flow or Step by Step Performance testing process – Jmeter or any tool

Performance Testing – Flow or Step by Step Performance testing process

  1. REQUIREMENT GATHERING FROM PO OR STAKE HOLDERS FOR PERFORMANCE TESTING OF
    API OR WEB APPLICATION or providing suggestion for performance testing for newly developed APIs or user side applications based on requirement and usage.
  2. BENCHMARK DEFINITION FOR API/WEB, Matrix creation for Threads and Rampup for creating Test scenarios PO & Tech leads
  3. TEST SCRIPT CREATION IN JMETER WITH MANUAL & RECORD & Playback
  4. Script modification for multiple data/parameterization of load.
  5. Test Server Setup with help of Infra team for separate execution of Jmeter script & enhancing servers requirement from Infra – Server capacity, memory
  6. Test execution with multiple loads & monitoring the response in multiple listeners. e.g. summary report, graphs etc.
  7. Server capacity increment to achieve desired load. (Including Jmeter running machine & Application server)
  8. Reporting with multiple listeners – excel report creations for errors.
  9. Presentation of report & conclusion to stakeholders/PO.

Get Token from URL Regex expression jmeter token=(.+)”

{​​”CMSMethod”:0,”URL”:”https://google.com.com/sitecore/login/MyInvestisSSO.aspx?token=%2fOtuP0oVKf7a974AwAgXHD6U49BZviMOBKhxnw9zvLVTsQoyKlCtMbG8G0hZCVJgZu0HFpOQ8HjbwW6L8mhVVVCehJsqXegD9qU1hbh4qHzoudytUwYtOrHxfFaKO4wQuUzuFkF45t%2f%2fi65IeY8RgshXJ7jLRN10wjGKInI0SKtO3OHTp8OvueIME0%2fefg%2b1wx4sp7SJeyQHmqPh75nVn%2fmz%2bqub9jGxg51ryX58POAchq0X56Y%2br%2be9Rd1PUXry7ArVFFgsDc9vcBisUPpA04WynjrB93z6HhITYbLi%2fWBbjqZJ7Jmd6YYizkYob4i0Wrf%2bJhDBVg8MrUC7aThLqcHgISul5suxF242TLWpLeecMaus%2b3FHDQFXKtEHUhTlVEGfAMprTCbTf2gZ6iEU%2bYzanOLmffPDepK%2f3DDKONH9UaeQIJvM6s9XIfwoDzXRwc%2b4LJscYtxhYYeIvqChLYSfWKHRydnPUxUqMiuuEzVonOGkooe8P%2fqJb6E7c21p14LSAD3mkVvsCIWsE40xqTUL%2bY5%2b29Si”}​​

OUTPUT VALUE:-

%2fOtuP0oVKf7a974AwAgXHD6U49BZviMOBKhxnw9zvLVTsQoyKlCtMbG8G0hZCVJgZu0HFpOQ8HjbwW6L8mhVVVCehJsqXegD9qU1hbh4qHzoudytUwYtOrHxfFaKO4wQuUzuFkF45t%2f%2fi65IeY8RgshXJ7jLRN10wjGKInI0SKtO3OHTp8OvueIME0%2fefg%2b1wx4sp7SJeyQHmqPh75nVn%2fmz%2bqub9jGxg51ryX58POAchq0X56Y%2br%2be9Rd1PUXry7ArVFFgsDc9vcBisUPpA04WynjrB93z6HhITYbLi%2fWBbjqZJ7Jmd6YYizkYob4i0Wrf%2bJhDBVg8MrUC7aThLqcHgISul5suxF242TLWpLeecMaus%2b3FHDQFXKtEHUhTlVEGfAMprTCbTf2gZ6iEU%2bYzanOLmffPDepK%2f3DDKONH9UaeQIJvM6s9XIfwoDzXRwc%2b4LJscYtxhYYeIvqChLYSfWKHRydnPUxUqMiuuEzVonOGkooe8P%2fqJb6E7c21p14LSAD3mkVvsCIWsE40xqTUL%2bY5%2b29Si

JMETER ERROR FOUND AND SOLUTION FOR LARGE SCALE USERS TESTING

  1. JMETER NATIVE THREAD CREATE ERROR – SOLUTION – Ugrade 32bit to 64 Bit Java
  2. Embedded resource error – set in jmeter properties set this httpsampler.ignore_failed_embedded_resources=true
  3. Java se not responding – Increase heap size to 10g and metaspace 2048m
  4. For getting good execution of Jmeter, on every execution, restart the Jmeter, it will release the JAVA SE memory and Jmeter will execute fastly.
  5. Regedit>Parameters> Set Maxportused error for address in use error in jmeter response
  6. TcpTimeWaitDelay error to solved port already in use issue
  7. view.results.tree.max_results=0 for getting all the result in result view tree listener in jmeter properties file

Combined single command to execute non gui mode and generate HTML report in JMETER from CSV.

SINGLE COMMAND

C:\apache-jmeter-5.0\bin\jmeter -n -t C:\apache-jmeter-5.0\bin\testnew.jmx -l C:\apache-jmeter-5.0\bin\testresults.csv -e -o C:\apache-jmeter-5.0\bin\HTMLReports

below is the syntax, ignore the brackets []

[JMeter path] -n – t [jmxfile to run] -l [csv file for generating result] -e -o [path of folder to generate the html report, folder must be empty]

Simple steps to learn HP Performance center or Load runner recording. Load runner tutorial in parallel to Jmeter concept.

Hi Friends,

Hope you all are doing well in your fields 🙂 and wish for more success in your life 🙂
Today’s our post is not for non-technical readers 😦 (Sorry for that 😦 ).

Today we are going to learn HP performance center or load runner or Vugen or Vugen scripts or you can say performance testing 🙂 .
Guys we have written many post for Jmeter previously and you can search those on our website and Jmeter is one of the best tool for doing performance testing.
But when you go to bigger or CMMi level companies then those people has a mentality that JMETER is a freeware and anybody can learn that – No big deal !! but they do not know what efforts it takes to use Jmeter. 😦 (Only Jmeter users know this 🙂 It is not that easy when it throws exceptions 😀 !!).
So today’s agenda is clear to you right ? We are going to use Load runner/performance center which is a license version software.
By reading this post, you will easily crack your interviews and even you can clear practical rounds too 😉 . If somebody has used Jmeter then this will be easier for them. So let’s start :-
[Some things will be high level in this post so please ask if you do not understand anything)

There are 2 component in HP load runner :-
1. Vugen (Virtual User generator) (To record and debug script using basic play).
2. Controller (to run Vugen scripts and get performance reports in detail)

We will learn How to create scripts in Vugen using record feature.

1. Install Vugen (Virtual user generator) for recording script and open it (I thought installation and setup will have no problem to anyone if you have purchased it 😉 ). Select File > New script and solution.
This is basic like we do in any of our tool.

2. Select Single protocol in left panel and click “Web- HTTP/HTML” request for web recording. (This is like we select HTTP request from Sampler in JMETER). Below is the image (Our mind captures images more faster that boring text 😉 for example if I right “Shakira” here in text or I show a pic of Shakira then what will be more sexy for you. LOL , come on the topic now 🙂 )

Load runner initial Vugen script creation

Load runner initial Vugen script creation

3. Now after selecting web http request, fill the name and some basic details and click OK. See below. Your screen should look like below 🙂

In above image, you will see that there are three nodes. Init, action and end. If you have used Jmeter properly or systematically 😉
then you have used simple controller to put login requests and close requests. Not getting my point 😀 . That’s why I used word Systematically :D.
Let me explain you – In Jmeter we use recording controller to capture our all requests, but what I generally do is I extract login requests from recording controller and put them in a simple controller and rename it Login request. Similarily I extract logout request and put them in another simple controller and rename it Logout requests. So all the time login and logout will be same so you do not need bother about their handling.
Similarly, in Load runner Init, Action and End will work. Init will take login or initial setup script, Action will contain main actions or main steps of script and End will contain logout or requests which you want to run after your main test. [I know you got my point now 🙂 and if not then stop reading here and use Jmeter first 😀 LOL, go ahead I will help you more].

4. Now what we do in Jmeter for recording ? We setup Http recorder in Work bench, then we take recording controller, then set proxy and bla bla bla….. right ? (asking to Jmeter users only 😀 ).
Here we have advantage, we do not have to setup that kind of stuff in Vugen script. Here just click and red button and enter what you want to record and where like your website URL and browser name. See below guys :-

load runner recording

5. Now we are almost ready to record. You have to click start recording button and you are ready. New browser will be opened with your application URL and a recording tool bar. See below :-
recording toolbar

6. Stop the recording after all your actions and new popup will open. User can replay and debug the script in Vugen also.

7. You can replay whole script as well as step by step individually. See below :-

8. Script will be seen as below after successful run –

So guys, you have successfully learned Load runner Vugen recording by above steps (Hope so 😉 ).

We are not streching this post because you may get bored in one day 🙂 . In our next post, we will learn how to run this above Vugen created script in HP- Controller.

Thanks for patiently reading the post and it is very easy to learn HP-Load runner. We will help you. (Some of load runner experts were thinking that what a boring post or what new you have done in this article, these are already mentioned in Load runner guide. 😀 but the new comers will love me after reading this as I have blended it with love of Jmeter 😉 ).

Thank you for your appreciation and donations 🙂 and if you really feel happy by reading this, then you can help us by donation using donation box or using paypal link https://www.paypal.me/knowledgeworldforyou 🙂 [Donation box is in the left side bar on our website]. We will be really grateful to you 🙂 and still we are 😉 .

Please visit us and like on social media to encourage us more for writing and sharing with You.
http://www.knowledgeworldforyouteam.com/
https://www.facebook.com/Knowledge-World-For-You-1660665640835573/timeline/

Please visit us and like on social media to encourage us more for writing and sharing with You.
http://www.knowledgeworldforyouteam.com/
https://www.facebook.com/Knowledge-World-For-You-1660665640835573/timeline/

Thanks!!
KnowledgeWorldforYou Team 🙂

How to Solve Message Signature Validation Failed error in Soap Request using JMETER or How to test Performance of SOAP webservice using Jmeter and aid of SOAP UI.

Hi Friends,
Hope you are doing good in your fields and will be planning to enjoy 31st December party of 2016. 🙂
We are here with the technical solution for SOAP UI request performance testing using JMETER and issues faced during that.
Simple SOAP request testing is easy and we all have done in our Software career (Sorry for non-technical and fresher guys this time, serious matter is going to be discussed 😉 ).
If you are testing SOAP webservice which is using a Certificate with specific password, then this post is for you.
When any webservice carrying data and that is secured by some Keystore certificates, then that is a tedious task to setup performance testing using JMETER.
Here SOAP UI tool will also be helpful to you. So let’s start with point format so that you can understand easily. (I am considering you all know the Basic JMETER usage and if not then please follow this link before “ http://knowledgeworldforyouteam.com/2015/01/13/jmeter-simple-steps-for-recording-proxy-test-script-in-browser/ ”)
1. Open Jmeter and add Thread group (Under Test Plan), one HTTP Header manager (Thread Group> Config. Element >), Http Request(Thread Group > Sampler >) and Keystore Configuration (Thread Group> Config. Element >). Your JMETER will look like this (ignore disabled element) :-

2. Now take the HTTP request and we will do the configuration for our SOAP request. We will enter the URL on which the request will be POST and some other parameters. See below :-

3. Now in above steps we have set parameters in HTTP request and in Body data, we have simply pasted our SOAP request.
4. Now if you have used or are using SOAP UI tool then it will be easy way to take exact request because in our Case the SOAP request is not the simple SOAP request. It is highly secure and bounded by Keystores, cookies and session IDs. So that it is easy way that if you have already setup the SOAP UI tool for sending requests then that will be helpful for JMETER too. As you all know JMETER is like a kid, you have to tell him each and every thing(Cookies, Headers and authentication) systematically otherwise it will start to CRY (Show error). So better is that if any tool is already providing systematic data then we do not have to do more hard work. [Because in companies, we are so much bounded by timelines that we have to do Smart work to get appreciation 😉 🙂 ]
5. Now in below steps you will see, we already setup SOAP UI tool and how to get specific data from that for JMETER. Look below – How SOAP UI looks alike –


6. Now you can see that there are two options in SOAP UI. RAW and XML to view any request and its parameters. It is better to run your request first in SOAP UI before doing its performance testing using JMETER.[Because if request is failing in SOAP UI then no use of doing performance testing 😉 No need to read ahead 😉 ]
7. Now after you have hit the request in SOAP UI tool and it is successful then click on RAW tab. Let see below :-


8. You all were thinking that why I am saying you to copy request from SOAP UI ??
The reason is that when you hit the request in SOAP UI and check the RAW value, you can see that RAW request is very much different than your Simple SOAP web service request. It includes the Secure heading values, many SSL parameters and all which you simply do not include in your request. That all are added by SOAP UI tool for sending the request on server.
It is like if you will blindly hit the simple webservice using JMETER, then it will show you error.
You have to all secure authentication values and other BLA BLA BLA…..parameters to make a successful request. That is why I told you in starting that THIS IS NOT A SIMPLE WEBSERVICE TESTING 🙂 .

9. Lovely readers, pay attention again 🙂 . So we are about to complete and about to win :).
Now we have to setup the HTTP HEADER MANAGER. You can take values for Header manager from above RAW tab. See again :-

10. Now in Keystore configuration element of JMETER, you can set the Preload value = True”.
11. Now try to hit run in Jmeter and check the result . You will get an error because you have not done the main work that is CERTIFICATE/KEYSTORE setting in JMETER. For setting Keystore file, you have to open you JMETER>bin>System.properties file in notepad and add following in that :-

javax.net.ssl.keyStore= path of your keystore file
javax.net.ssl.keyStorePassword= password of the keystore

Above lines are very important otherwise your server will not authenticate JMETER to post request. So please do that. Save the file and better to close it and restart the Jmeter, PLEASE SAVE YOUR JMETER WORK FIRST. 😉 or don’t blame me 😀 .

12. Now start the JMETER and open the saved JMETER file and Run it. You will get success :). See below :-

13. Friends may be your requests will get succeed and later on will not. Means they may fail again when you run that so you have to again copy paste the request from SOAP UI tool. Only copy the request, all setup will be same. Just paste the request in HTTP request BODY in JMETER. Failure reason is that Every time session ID and cookies will get change. Or if you require permanent solution, then get runtime cookies values using regex or other option of JMETER.
As you are aware if something is frequently changing, then you have to write regex to get new value every time (I hope you know this 😉 otherwise search our blog for Regex expression learning 🙂 )

This is the last post for 2016 🙂 .
Thanks for patiently reading this and we hope this will help at least one people on this EARTH. 🙂
Please share your views in comment section :).

Please visit us and like on social media to encourage us more for writing and sharing with You.

http://www.knowledgeworldforyouteam.com/

https://www.facebook.com/Knowledge-World-For-You-1660665640835573/timeline/

Thanks again!!
KnowledgeWorldforYou Team

Regular Expression extractor in Jmeter to extract 0116/BRD/0000267 from this number “484,0116/BRD/0000267”

Hello Friends,

Hope you are doing good. Today I was stuck in making the regular expression for the response number I was getting in a request. I had to use the response of one request as an input to another request.

I was getting response “484,0116/BRD/0000267″ and I want to extract  0116/BRD/0000267 from this number. So here is the regular expression for this.

,(.+)?\”

This worked for me in Jmeter. Here

, = was bcas I want string after this

(.+) = Was for the whole string and numbers

?= was to stop when I got result

\” = was to stop before ” (inverted comma)

Below is the image so you can get more Idea-

response2

Hope it will be helpful to someone in some age 🙂

You can also check your regular expression on each request using view result tree listener and select Regextester in place of text from drop down.

Thank you for reading. Please follow us on social media to encourage us to right and share more with you. Your “likes” and “follows” are gift for us. 🙂

https://www.facebook.com/Knowledge-World-For-You-1660665640835573/timeline/

https://twitter.com/you_knowledge

Simple steps to learn Selenium grid or How can you use selenium grid and Jmeter CPU performance. 22 Steps to learn Selenium grid

Learn Selenium Grid

Simple steps to learn Selenium grid or How can you use

selenium grid and Jmeter CPU performance. 22 Steps to learn

Selenium grid

Hello Friends,

Hope you all are doing good in your fields…… 🙂

By using Selenium Grid, you can run a single functional

testing code of selenium on multiple machines simultaneously.

You can use selenium webdriver and Jmeter simultaneously

to check the performance of the Application server. How ??

Run your functional code on 10 machines using selenium grid

and check the performance of the application server using

Jmeter CPU memory usage(Perfmon plugin). 🙂

What ever you can test on tools but real performance is

achieved only when the application runs on physical

machine in real time. So we are sharing the steps to

simply setup the Selenium grid on machine.

  1. First download the Selenium standalone server(RC)  current version 2.48.2 from the Official selenium website (http://www.seleniumhq.org/download/)
  2. Now put the downloaded Jar file usually naming                                    selenium-standalone-server.2.48.2.jar on any folder
  3. Now this selenium jar file will not be executed directly.     You have to execute this using command prompt(run>cmd)
  4. Firstly you have to locate the path where you selenium  standalone jar file is. Like if it is on your desktop then in cmd your path should be C>Desktop
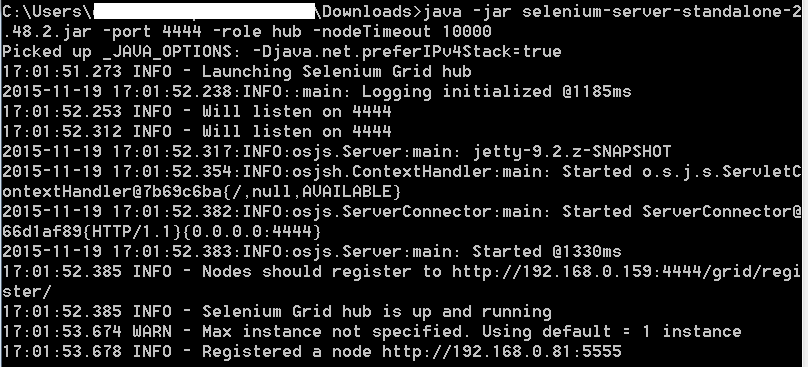
  5. Now you have to execute the following command  to run the selenium server

java -jar selenium-server-standalone-2.48.2.jar -port 4444 -role hub -nodeTimeout 1000

Java -jar selenium-server-standalone-2.48.2.jar -port 4444 -role hub -nodeTimeout 1000


This 2.48.2 version may be change so you  should be aware that which file you have downloaded from website.

This command you have to executed on the system  to which you want to make hub.

What is hub ?  Hub means the machine from where you  will execute your test like where you have code for your selenium.

Node – node means the machine/machines where you  want to run the selenium code of your hub machine.  Hub is the center from where you will trigger the automated  test and that single automated test will be executed on  all the connected node machines if you have setup them correctly 🙂

When you will run the above command on hub machine  then it will look like this –

1

It can show you failure message if port 4444 is already  being used on your machine. So you can change the port like 4445 or whatever you like.

2

  1. Now your server is started so you can go and  check if it is running correctly –

Open browser and hit http://localhost:4444 (localhost=192.168.0.159)  or the port you have used

3

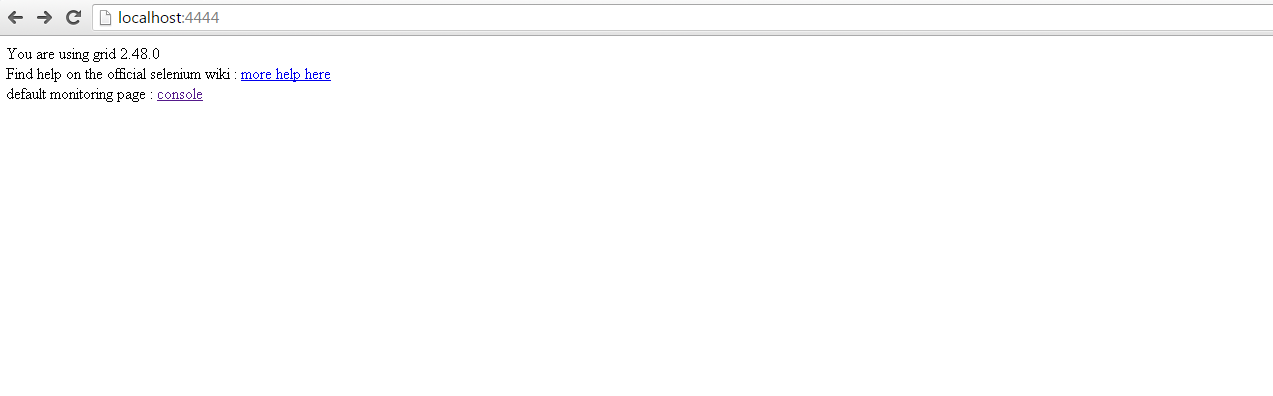
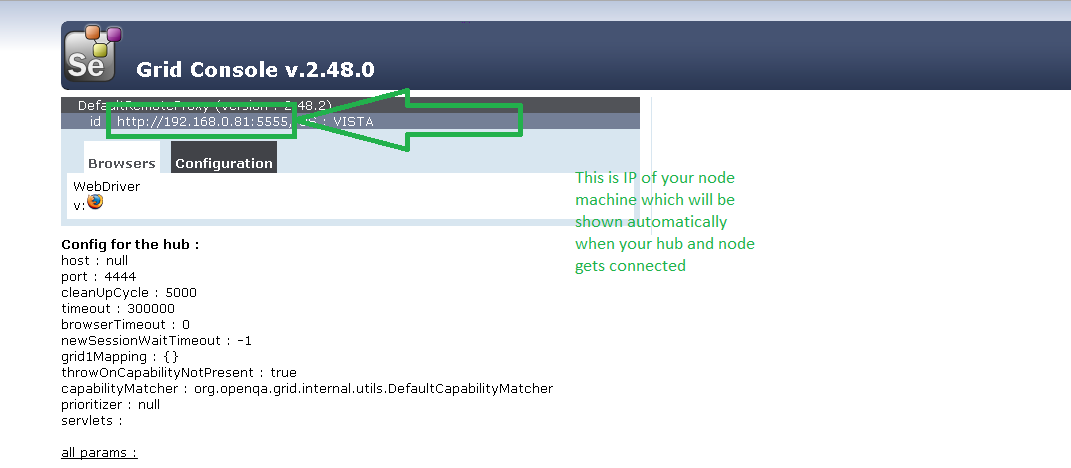
  1. You can click on the link – Console and check the configuration.

4


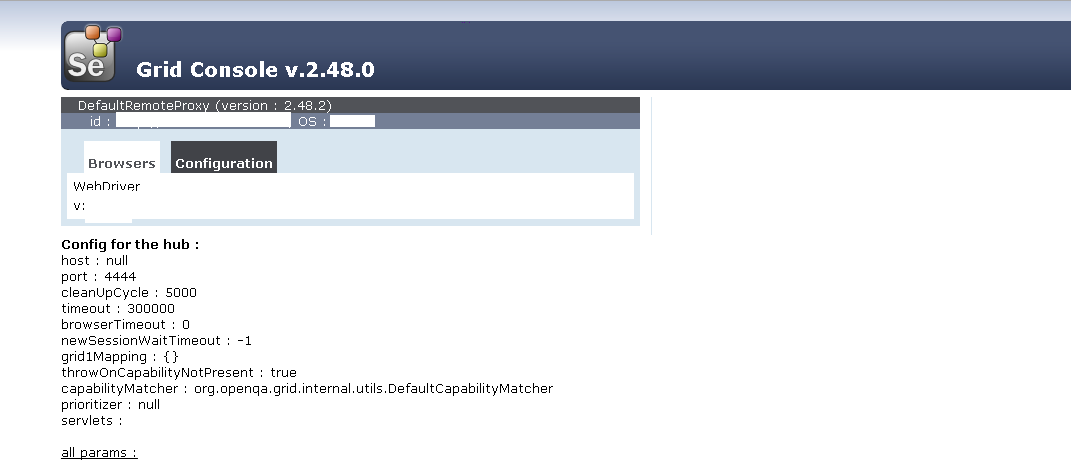
  1. Now your hub is configured correctly 🙂
  2. Now you have to configure your nodes(machines  where you want to run your test)
  3. To configure the node, share/download the same  selenium standalone server file on all the nodes where you want to run the test.
  4. On node machines, you have to run the following  command to run node server and connect the hub
  5. java -jar selenium-server-standalone-2.48.2.jar -role node -hub http://192.168.0.159:4444/grid/register -browser browserName=firefox -port 5555
  6. In 12thstep, ip 192.168.0.159:4444 is the IP of the  hub which we have configured in above step.
  7. So the conclusion is that we are connecting node  machine to the hub machine using above command
  8. If your command is executed successfully on the  node machine then check your Hub machine and  hit the same URL above provided http://localhost:4444 and check that Hub and server is connected.

5

  1. Now you are ready with your servers hub and node.  Now you have to code the selenium program  using remotedriver commands on your hub machine 0.159 here –

public class TestNGClass

{

public WebDriver driver;

public String URL, Node;

protected ThreadLocal<RemoteWebDriver> threadDriver = null;

@Parameters(“browser”)

@BeforeTest


public void searching(String browser) throws MalformedURLException

{

String URL = “http://www.google.com&#8221;;

browser.equals(“firefox”);

System.out.println(” Executing on FireFox”);

String Node = “http://192.168.0.81:5555/wd/hub&#8221;;

DesiredCapabilities cap = DesiredCapabilities.firefox();

cap.setBrowserName(“firefox”);

driver = new RemoteWebDriver(new URL(Node), cap);

// Puts an Implicit wait, Will wait for 10 seconds  before throwing exception

driver.manage().timeouts().implicitlyWait(10, TimeUnit.SECONDS);

// Launch website

driver.navigate().to(URL);

driver.manage().window().maximize();

}

@Test

public void search()

{

driver.findElement(By.xpath(“testxpath”)).click();

driver.findElement(By.xpath(“test2xpath”)).click();

driver.findElement(By.id(“test”)).sendKeys(“5”);

driver.findElement(By.id(“test2”)).sendKeys(“20”);

}

}

  1. Work is not completed here friends :). Your  program is ready but how it will communicate  with the node server. For that you have to create/generate  an XML file. Now like me you can also be feared out  XML file???? How to write XML bla bla… 🙂 but don’ t worry it is very simple XML file in which only you have to pass parameters like for above program.
  2. Go to eclipse or whatever editor you are using(here we are using eclipse) and right click on the project and select new>Other>

6

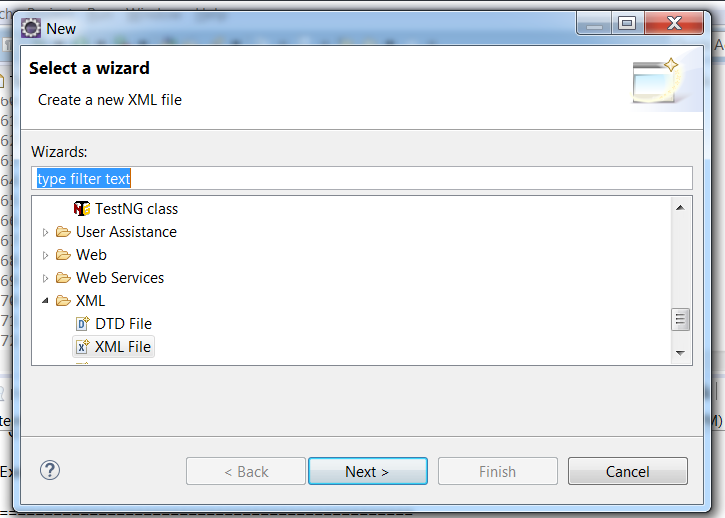
Now select XML file as shown above and it will open a  blank XML file to you

Now write the code in them for XML like in our case above

<?xml version=“1.0” encoding=“UTF-8”?>

<!DOCTYPE suite SYSTEM “http://testng.org/testng-1.0.dtd”&gt;

<suite name=“Suite” parallel=“tests”>

<test name=“FirefoxTest”>

<parameter name=“browser” value=“firefox” />

<classes>

<class name=“TestNG.TestNGClass” />

</classes>

</test>

</suite>

Now you can see this XML is very simple. We have only  write browser parameter, class parameter and their value. Browser parameter value is firefox as we need to run on  firefox, you can choose IE or chrome too.

Class name is the class name we have given during class creation.

  1. Now you are ready to run your test. Simply right click  on newly created XML file> Run as> TestNG Suite
  2. This will successfully run your code on your node machines.

Sometimes it shows an error of FAILED CONFIGURATION:  @BeforeTest launchapp

org.testng.TestNGException:

Parameter ‘browser’ is required by @Configuration on  method launchapp but has not been marked @Optional or defined

  1. in C:\Users\AppData\Local\Temp\testng-eclipse-1750918716\testng-customsuite.xml
  2. So go to your above XML file which we have  created in step 18 and check browser value = firefox. If  it is already there, then just save the file and run it,  because sometimes doing no change and only save can make a huge change 😉

So this above 22 steps can easily teach you how to run any  test on remote machines.

Here in above code, IDs,Xpaths are false so please do not just copy paste and try to run 😉

Thanks for reading and please like/follow us on  social media to encourage us for writing more 🙂

https://www.facebook.com/Knowledge-World-For-You-1660665640835573/timeline/

https://twitter.com/you_knowledge

Thanks

KnowledgeWorldForYou Team

Simple interview questions mostly asked to a Manual or Automation software tester/QA

Hello Friends,

Hope you are doing good. Recent days I have faced many interviews of highly reputated companies for Manual and automation tester/QA position
and found some questions in each interview of different questions. By the way I was not looking for any job 😉
I just went there to test my knowledge and it was a great experiences. So here are they.You will found some answers near some of the questions.

Company 1
1. What is V model of testing? each step. ?
2. Jmeter for loading 20 users then what assertions will you use?
3. If you have 20 users parameters and if you want to use in your program then How will you use that file in Jmeter for external parameters. ?
4. How do you write code for check boxes, radio buttons in selenium webdriver ?
5. How to do database testing using Jmeter ?
6. How to unit testing and load testing the with Jmeter and Junit?
7. Difference between test case and test plan.

Company 2
1. what is object?
2. Access identifiers ? Public, private and protected
3. Example of inheritance
4. Element identifier ?By ID, BY.xpath
6. which errors I found in selenium webdriver ?Webelement not found and path error
7. Regression and retesting differences
8. Traceability matrics – To trace the requirement completion
9. What is abstraction ?
10. What is overloading
11. Concept of OOPs inheritance, incapsulation
12. Priority and severioty – example of transaction machine. ATM – transaction done but slip is not generated

Company 3
1. System and integration testing difference ?
2. How to monitor that windows service is working or not ?
3. How to check application server is running or not?
4. How to check that data base is encrypted and what are encryption methods
5. Regression testing and retesting
6. Difference between integration and system testing
7. what is top to bottom and bottom to top process, pls explain with example ?

Company 4

1. What is parametrization?
2. Statement coverage using selenium ?
3. Difference between selenium IDE and selenium RC
4. Differ status of bug ?
5. What is testing strategy and test plan ?
6. What is RTM- Requirement traceability matrix ?
7. What is Pesticide paradox ?
8. Whatis deferred status in defect life cycle management – Rejected or Deffered?
9. What is Backward traceability ?
10. When will actual testing starts?
11. What is Requirement testing – static testing/verification ?
12. What is repository in automations ?
13. What is my role in project for automation using selenium?
14. How to test statement or Condition coverage using Selenium?

Company 5

  1. Which tool you use for bug tracking? Have u used Jira ?
  2. How you will decide that a bug should be critical or not?
  3. What will you do when you got an issue before the day of release and no body is there from team lead. Only you and some developer?
  4. What if you have provided one liner requirement and you have to prepare test case?
  5. What if developer says that this is not a bug than how will you solve the situation?
  6. STLC/Testing life cycle
  7. Reverification/regression and Retesting difference?
  8. What is your role in current project?
  9. Which tool you use for automation ?
  10. Value can be set null for foreign keys?
  11. BUG Tracking
  12. Negative test cases

Thanks for reading and giving your time. Please like us on facebook to encourage :)-
https://www.facebook.com/pages/Knowledge-World-For-You/1660665640835573
Regards
KnowledgeWorldForYou Team